|
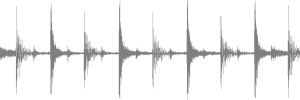
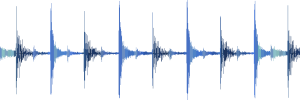
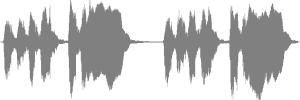
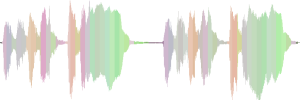
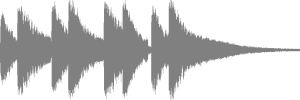
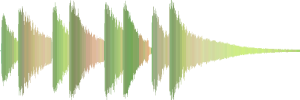
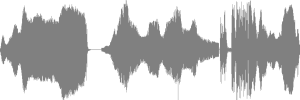
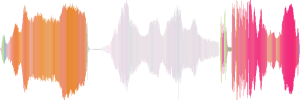
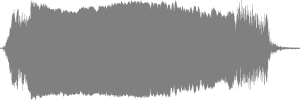
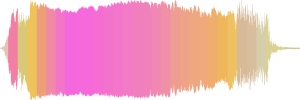
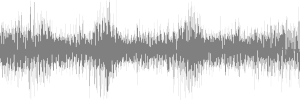
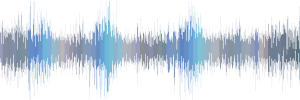
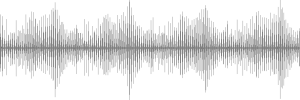
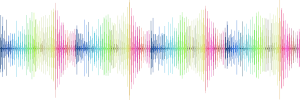
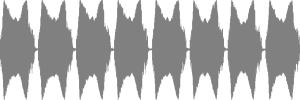
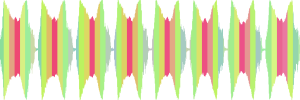
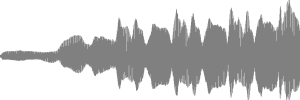
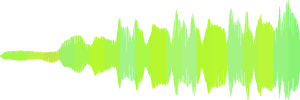
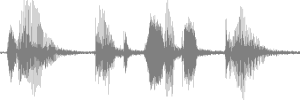
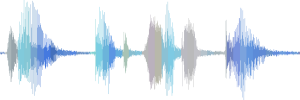
The most common visual
representation of audio is its waveform display, which is a graph of
amplitude (loudness) over time. It indicates when the audio is
loud or soft, but provides no information about how the audio
sounds. This is remedied by a Comparisonics patented invention:
colors are derived automatically from the frequency content of audio and
used to paint the waveform display, making it possible to see
the sounds! In rough terms, shades of red are used for high-pitched sounds; greens and blues are used for mid-range sounds; and bass sounds are represented by dark colors. Similar sounds are indicated by similar colors, and changes in sound are shown as changes in color. The coloring makes the waveform display tremendously more useful. See examples of colored and uncolored waveform displays in the Sound Gallery below; click on any waveform display to play the sound that is pictured. You can also download a QuickTime Demo (3.3 MB). See articles for more information. The Comparisonics waveform display is used to represent sounds in FindSounds.com, FindSounds Mobile, FindSounds for Android, FindSounds Palette, Comparisonics Audio Editor, Magix Samplitude, Magix Sequoia, and Native Instruments Traktor. We are pleased to hear from users of Avid Pro Tools, Sony Sound Forge, and other audio systems who would like to see the Comparisonics waveform display added to these products. Please let the makers of these systems know of your interest in "seeing" sounds with the Comparisonics waveform display!
|
© 2016 Comparisonics Corporation